This is my first ever attempt at ‘live blogging’ and haven’t done any tidying other than cropping images. You might want to explore the LASI-UK a twitter summary by @sheilmcn (complete #lasiuk twitter archive here)
Sheila MacNeill (JISC CETIS)
Setting the scene: learning scenarios
[Slides are here http://www.slideshare.net/sheilamac/lasiuk-learningscenarios-smn]
Overview of learning scenarios, broad-brush, what data do we have access to. Where does it take place? Learning taking place in various places in institution but not forgetting informal setting.
Various places where we communicate and learn (synchronous and asynchronous), which is creating a data footprint both formal and informal. Opportunities to merge data
University of Derby learner engagement dartboard. Uses primary, secondary and tertiary indicators. Used to build fuller picture of the student and engagement with institution.
Using SNA to help understand learning. Example of using SNAPP for discussion board analysis.
Example from me of dashboarding Canvas Discussion forums in Google Spreadsheet and TAGSExplorer to ‘see’ conversations.
Diagram developed by Mark Stubbs for tackling the LA problem space ‘analytics to develop understanding’
What actionable insights can we gain? Examples include patterns of behaviour, targeted intervention, benchmarking, retention, activity design, data driven design decisions, greater understanding of the who, why what and where of learning
Clare Llewellyn (University of Edinburgh)
Argumentation on the web – always vulgar and often convincing?
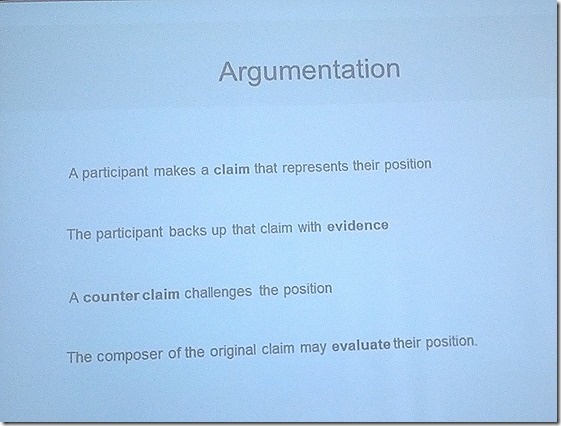
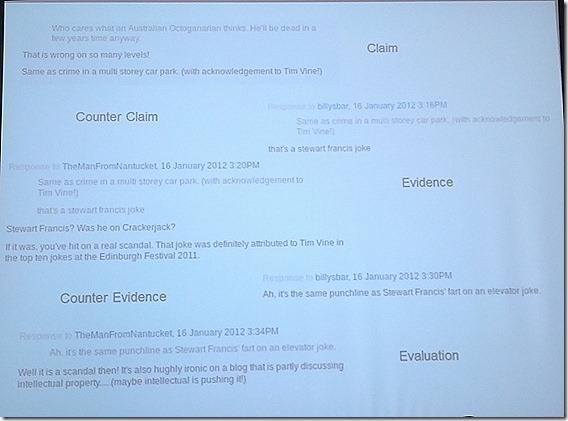
Using argumentation to analysis the social web. Session title is from Oscar Wild quote. Example, discussion around an typical Guardian post includes threading quoting etc.
Breaking down the discussion into conversations with specific topics, main points of the discussion. Issue is data deluge, how do we find the points of most interest. Solutions: BBC tried using editors picks but issue creates snapshots and not whole conversation.
Argumentation
Result
Various levels of argumentation micro and macro level.
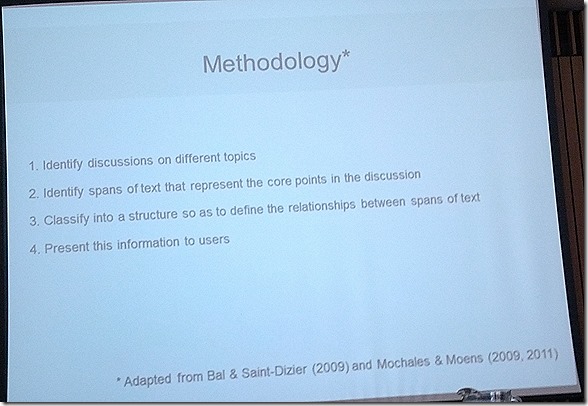
Methodology
Data – using twitter data from the London riots (7729)
Identification – Unsupervised clustering machine learning. Select an appropriate algorithm. Strategy is try and see. Tried Unigram/bigram, incremental clustering, k-means, topic modelling. Topic modelling proved best in this example.
Guardian comments – using api to extract claim (quoted text) counter claim (comment). Using LTT – TTT2
Supervised machine learning – data from London riots which has already been marked up. Tools: TagHelper Lightside? Using claim (text) evidence (link)
Duygu Simsek (Open University)
Towards visual analytics to improve scientific reading & writing
[Slides are here http://www.slideshare.net/dsimsek/lasiuk-talk030713-2]
[wordpress app decided not to save my notes :(]
Naomi Jeffery (Open University in Scotland)
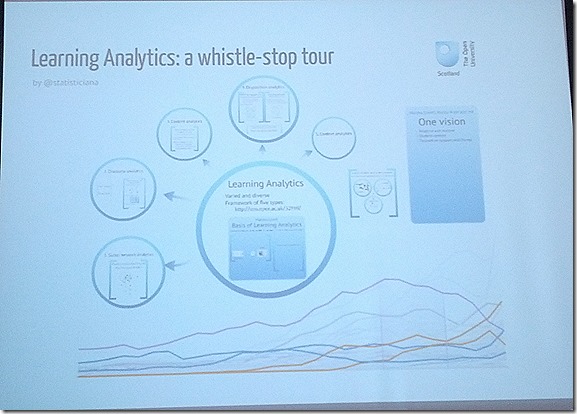
Learning analytics: a whistle-stop tour
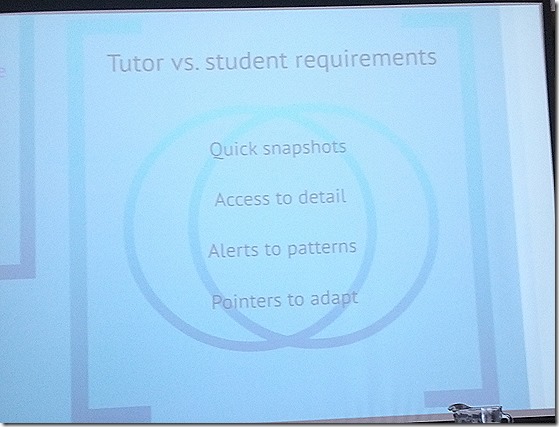
Overview of papers Naomi has recently found interesting. Marshal Lovetts (lak13) – no conception of what the data we are looking at actually means in the real world, remembering the person and learning design. Tutor v student requirements.
Overlap between needs.
5 types of LA. Social network analytics – visualizing social learning ties from Network awareness tool. Platform used to explore support learner communities.
Discourse analytics – bit.ly/16ByD1l – meaningful traces from speaking and listening within online discussion forums. Using 9 metrics and then supporting students in interpretation. Discovered that presenting numbers (rather than visualisations) had better results. As helping students developed desired behaviours
Context? Analytics Understanding promotions (how can student ‘liking’ posts can be used to promote content)
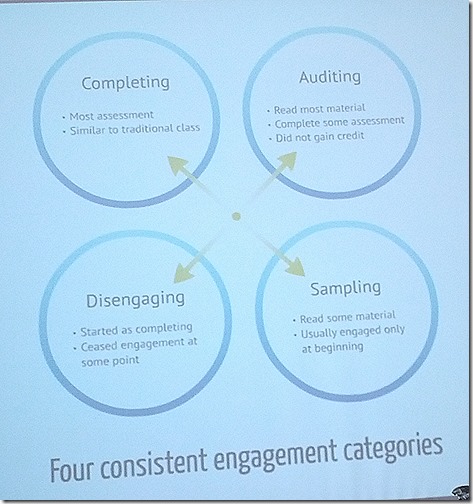
Disposition analytics – mooc disengagement identifying learner subpopulations. developed categorization of completing, auditing, disengaging and sampling
Learning pathways – http://stanford.io/123tufg Five learning methods minimal, careful, strategic explorers, explorers and haphazard. Prior knowledge an influence the model
Context analytics
Whether online, classroom, blended. Framework paper has several examples.

![wp-1373015570667[1] wp-1373015570667[1]](http://mcdn.hawksey.info/wp-content/uploads/2013/07/wp-13730155706671_thumb.jpg)
![wp-1373015755728[1] wp-1373015755728[1]](http://mcdn.hawksey.info/wp-content/uploads/2013/07/wp-13730157557281_thumb.jpg)
![wp-1373015881650[1] wp-1373015881650[1]](http://mcdn.hawksey.info/wp-content/uploads/2013/07/wp-13730158816501_thumb.jpg)
![wp-1373015982307[1] wp-1373015982307[1]](http://mcdn.hawksey.info/wp-content/uploads/2013/07/wp-13730159823071_thumb.jpg)
![wp-1373016067499[1] wp-1373016067499[1]](http://mcdn.hawksey.info/wp-content/uploads/2013/07/wp-13730160674991_thumb.jpg)
![wp-1373016387338[1] wp-1373016387338[1]](http://mcdn.hawksey.info/wp-content/uploads/2013/07/wp-13730163873381_thumb.jpg)

Add a comment